Nearly 13 kg Lost, Almost All of It Fat: An 8-Week Residential Fitness Bootcamp Case Study
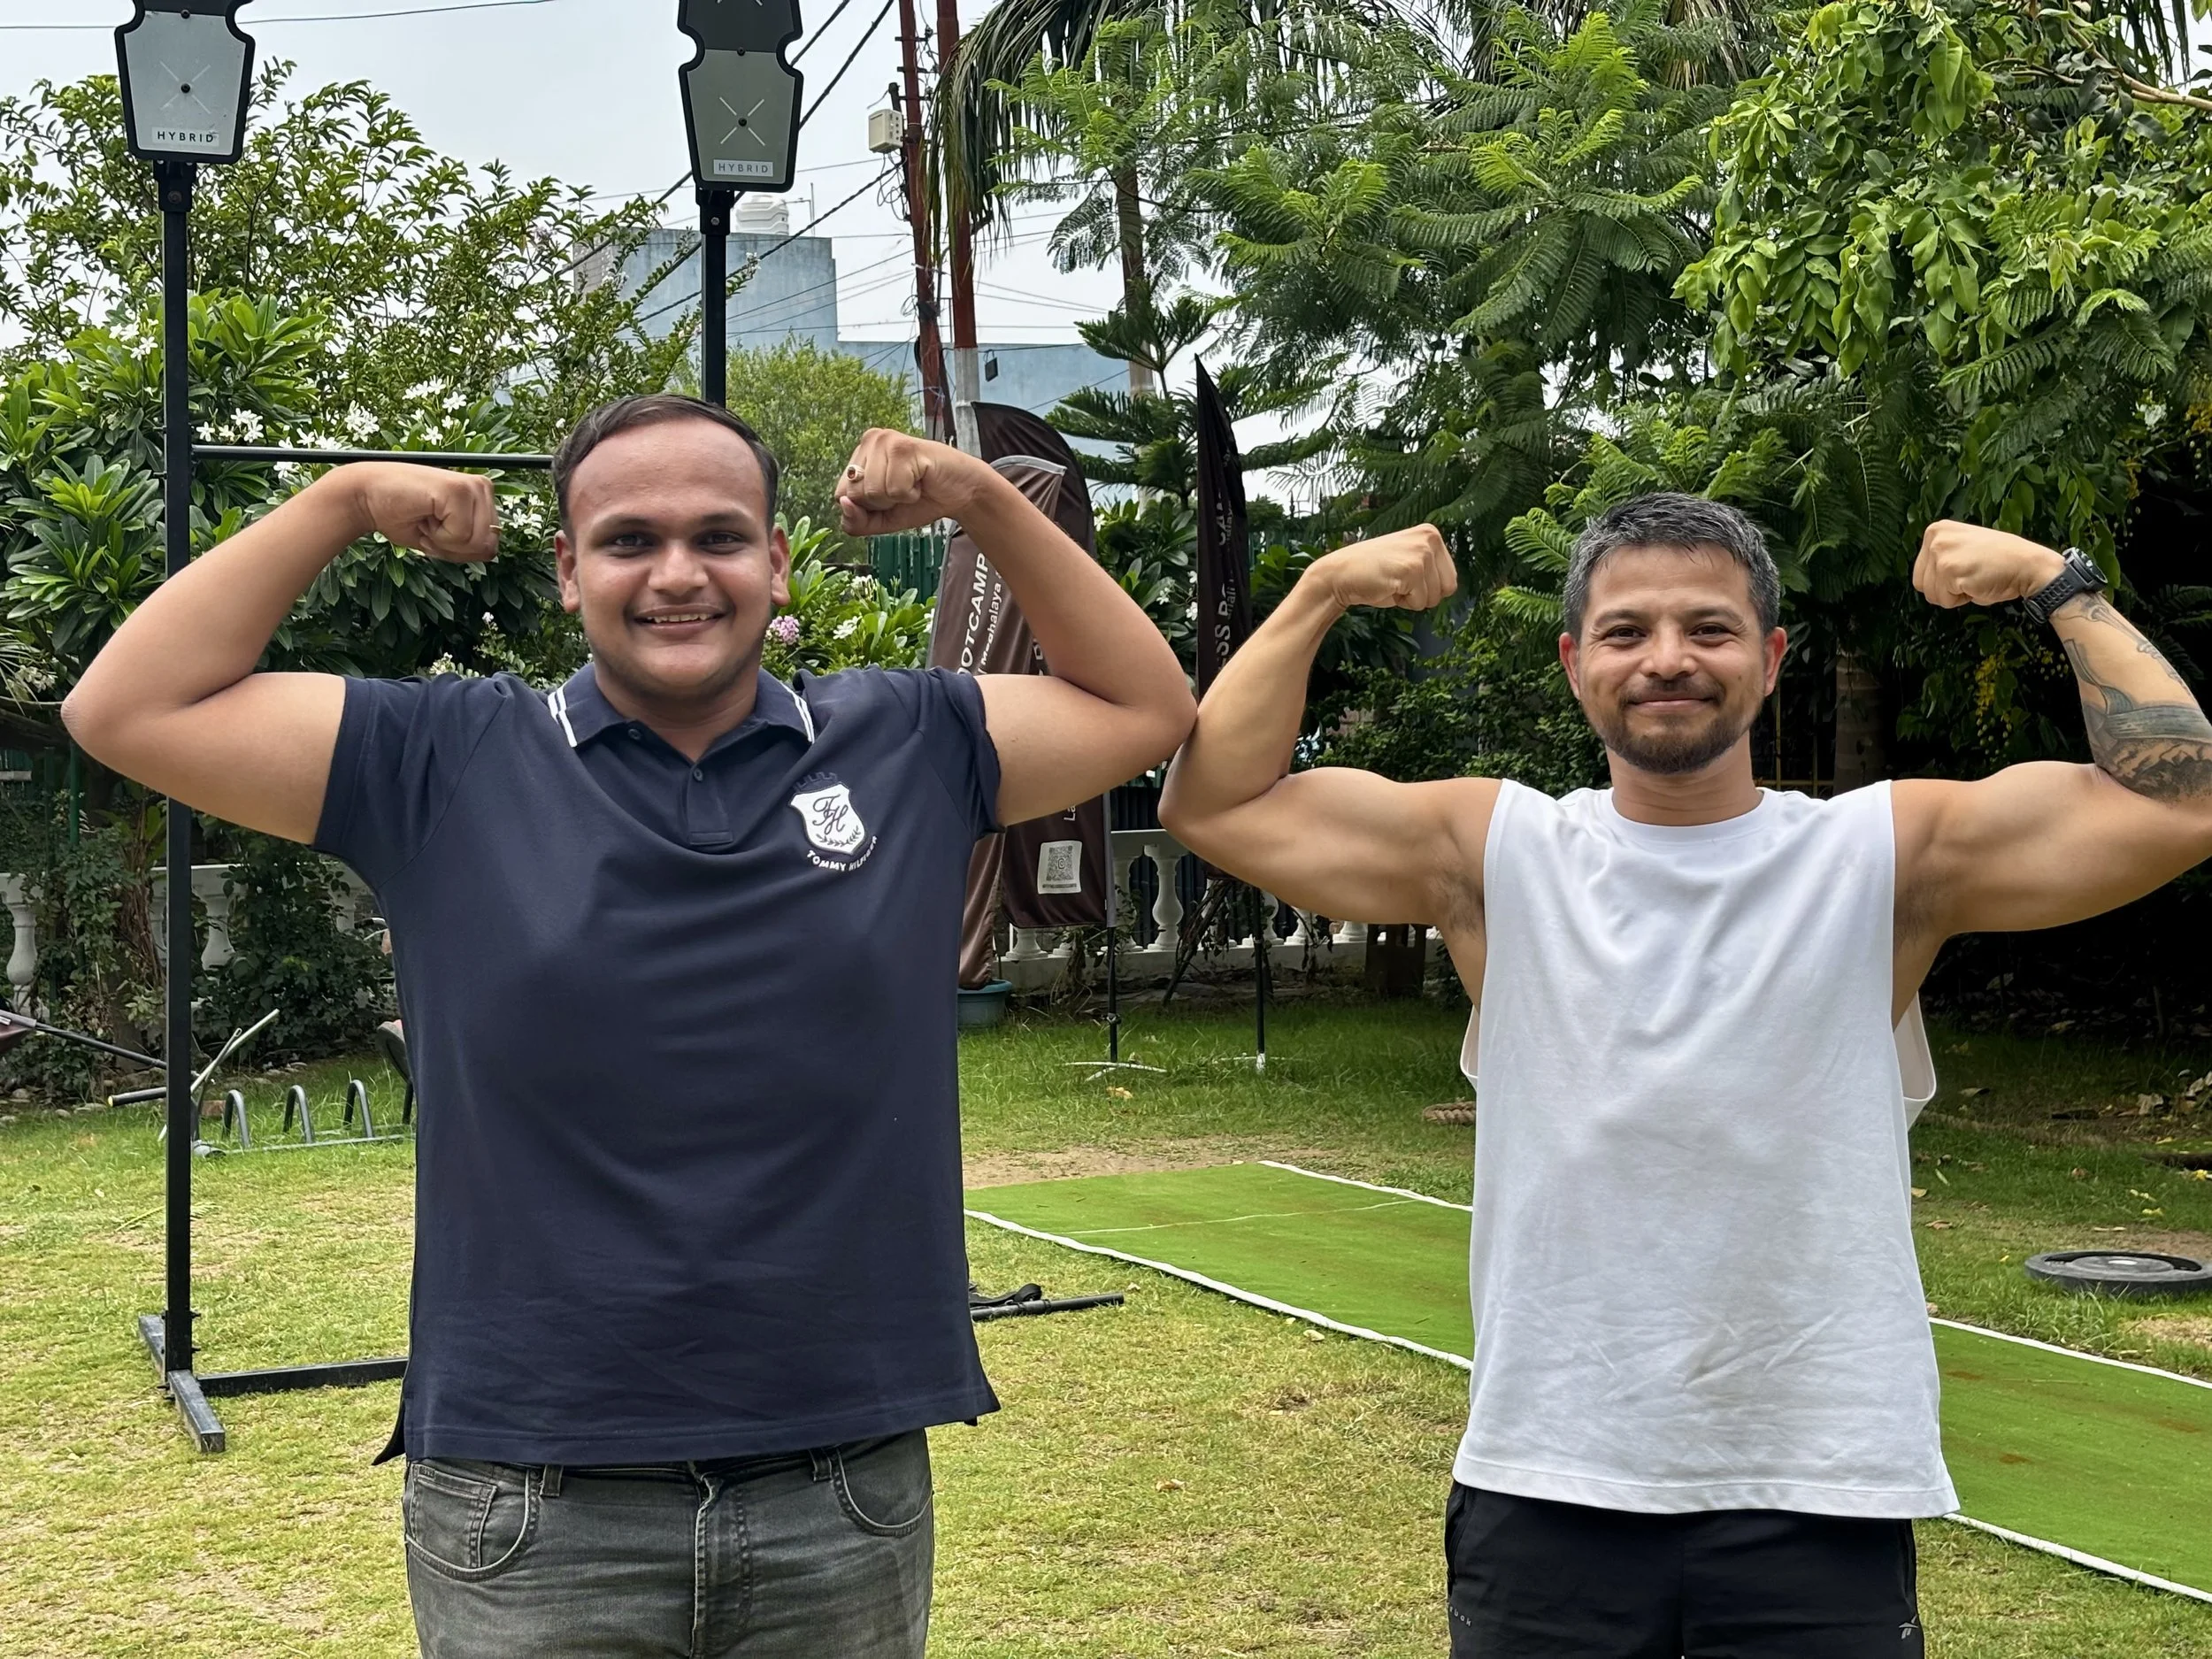
Samkith J. with Coach Niraj Kumar Borah at the end of his 8-week residential program, Rishikesh, June 2026. Published with written consent.
This is a documented look at what an evidence-based residential fitness camp does to the body over eight weeks. We tracked body composition with two separate methods and ran more than 35 blood biomarkers across three timepoints. What follows is the honest version: what improved, what didn't, and what we still need to confirm.
Summary
Most residential fitness camps and fat-loss bootcamps are sold on photographs. This case study reports the physiology instead. Across an 8-week residential program, we combined bioelectrical-impedance (BIA) body composition, manual tape measurements, and three blood panels from NABL-accredited laboratories.
The participant, Samkith J., is a 24-year-old male who entered the program at roughly 113 to 115 kg, a BMI near 38, and about 44 to 45% body fat. His baseline bloods showed atherogenic dyslipidaemia, vitamin D and B12 deficiency, low-grade inflammation, and borderline iron status.
Over the program his body weight fell by about 12.9 kg on the manual scale and 10.6 kg on the BIA scale (measured over a slightly shorter window). The BIA reading is the more useful one for quality, because it breaks the loss down by compartment. It showed fat mass falling by 10.7 kg, from 49.5 to 38.8 kg, while total body water and protein mass stayed the same and skeletal muscle rose by 0.3 kg. In plain terms, almost all of the weight he lost was fat, and his lean mass held. Body fat came down to 37.9%, and two independent measurement methods agreed on that figure. His basal metabolic rate barely moved (1,741 to 1,743 kcal), so the metabolic slowdown that derails most diets did not happen. Waist circumference dropped by 12 cm.
These changes came alongside meaningful improvements in his bloods: triglycerides down 56%, apolipoprotein B down 22%, vitamin D up 325% (from deficient to sufficient), B12 up 98%, HbA1c down from 5.5 to 5.2%, and inflammation lower than baseline. One panel showed a sharp, temporary rise in liver enzymes (AST 344, ALT 104 U/L). He had completed a hard HYROX-format circuit about 24 hours before that blood draw, which is the most likely cause, and a rested repeat panel is scheduled to confirm it.
This is a single-participant case study. It describes one person's data and does not represent typical or expected results. It is not medical advice. See the full disclaimer at the end.
1. Why We Publish Body Composition and Biomarkers Instead of Photos
A photograph is real, but it is also the easiest thing in fitness to stage, light, dehydrate, and angle. More importantly, a photo cannot tell you whether someone lost fat, muscle, or water. A person can drop 11 kg, look smaller, and have lost a chunk of the lean tissue that protects their metabolism for life.
So we measure. A serious program should be able to show its work in numbers that cannot be lit or angled: objective body composition, and blood markers from accredited labs. This case study reports both, and it measures body composition two different ways so the result can be checked against itself. The structure follows a clinical case report, because that is the format that separates evidence from marketing.
2. Participant Profile
| Attribute | Detail |
|---|---|
| Participant | Samkith J. (published with written consent) |
| Age / Sex | 24 years / Male |
| Height | ~172 cm |
| Entry weight / BMI | ~113 to 115 kg / ~38 kg/m² |
| Endpoint weight / BMI | 102.5 kg / ~34.6 kg/m² |
| Entry body fat | ~44 to 45% |
| Program | 8-week residential fitness program (Rishikesh) |
| Dates | 19 April to 12 June 2026 |
| Baseline concerns | Obesity (~44 to 45% body fat), atherogenic dyslipidaemia, vitamin D deficiency, B12 insufficiency, elevated hs-CRP, borderline-low iron |
3. Aims
- Would eight weeks produce fat loss while preserving lean mass and metabolic rate?
- Would atherogenic lipid and glycaemic markers shift meaningfully?
- Could the documented micronutrient deficiencies be corrected inside the window?
- Would serial monitoring catch, and correctly interpret, any adverse or unexpected result?
4. Methods
4.1 Timepoints and instruments
| Timepoint | Date | Body composition | Anthropometry | Bloods |
|---|---|---|---|---|
| Baseline | 17 Mar / 19 Apr / 22 Apr | BIA (22 Apr) | Manual (19 Apr) | Panel (17 Mar) |
| Mid | 15 / 18 May | none | Manual (18 May) | Panel (15 May) |
| End | 11 Jun 2026 | BIA (11 Jun) | Manual (11 Jun) | Panel (11 Jun) |
We used two body-composition methods. The first was a consumer bioelectrical-impedance scale (Cult Smart Scale Pro), which estimates fat mass, skeletal muscle, protein, total body water, mineral, visceral and subcutaneous fat, and BMR. We took BIA readings at the start and end. The second was manual tape measurement plus a field body-fat estimate, taken at three timepoints. Separately, body weight was logged daily at home, several times a day, as a monitoring and adherence tool rather than a precision measurement. Blood panels were drawn at three NABL-accredited laboratories.
Two things about the timing matter for interpretation. The baseline blood panel (17 March) was taken about four weeks before check-in, so some change predates the program. And the final blood draw (11 June) followed a hard HYROX-format circuit by roughly 24 hours, which is central to reading the liver-enzyme result in Sections 5.8 and 6.3.
4.2 What we measured in blood
The panels together covered more than 35 parameters: complete blood count and red-cell indices, iron studies, a full lipid and apolipoprotein profile (including ApoB, ApoA1 and Lp(a)), liver function, renal function with CKD-EPI eGFR, HbA1c and fasting glucose, 25-OH vitamin D, B12, homocysteine, hs-CRP, thyroid profile, total testosterone, and a 22-element heavy-metal screen by ICP-MS.
4.3 How we read the data
BIA reports fat and fat-free compartments directly, and we cross-checked its body-fat figure against the manual estimate. As this is a single participant, we apply no statistics. Findings are described and compared against the published literature.
5. Results
5.1 Body composition
Here is the BIA data from start (22 April) to end (11 June).
| Compartment | 22 Apr | 11 Jun | Change |
|---|---|---|---|
| Body weight (kg) | 113.1 | 102.5 | −10.6 |
| Fat mass (kg) | 49.5 | 38.8 | −10.7 (−21.6%) |
| Skeletal muscle mass (kg) | 35.7 | 36.0 | +0.3 |
| Protein mass (kg) | 12.6 | 12.6 | unchanged |
| Total body water (kg) | 46.6 | 46.6 | unchanged |
| Mineral (kg) | 4.4 | 4.5 | +0.1 |
| Body fat (%) | 43.8 | 37.9 | −5.9 points |
| Visceral fat (scale index) | 16.0 | 13.0 | −3.0 |
| Subcutaneous fat (kg) | 45.1 | 35.3 | −9.8 |
| BMR (kcal) | 1,741 | 1,743 | preserved |
| BMI (kg/m²) | 38.2 | 34.6 | −3.6 |
| Body score | 46 | 59 | +13 |
The story here is the quality of the loss. Of the 10.6 kg the scale recorded, 10.7 kg was fat. Total body water and protein mass were identical at both readings, and skeletal muscle went up slightly. His fat-free mass was effectively unchanged, around 63.6 to 63.7 kg. Two things follow. First, this was not water weight, which is the usual and often correct objection to fast loss, but does not apply here. Second, his basal metabolic rate held steady, so he avoided the metabolic drop that defeats most diets.
A note on how much weight that table can carry. A BIA scale measures one number directly, body weight, and then uses an algorithm to split it into compartments, so the fact that the compartments add back up to the weight is a feature of the method, not independent proof. The stronger evidence is that two different methods landed on the same body-fat figure. The manual field assessment recorded body fat falling from 45.0 to 37.9% across three timepoints. The BIA recorded 43.8 to 37.9%. Both converge on 37.9% at the end. Independent methods rarely agree that closely by accident, and that agreement is what gives the result weight.
Body weight was also logged daily through the program. The fasted morning weight came down steadily from about 115 kg at the start to 102.5 kg at the end, week after week, rather than dropping sharply and rebounding. A smooth multi-week decline like that is the signature of genuine fat loss, not the water and glycogen swings that make crash diets look dramatic and then reverse. These were home-scale readings used for monitoring, so the BIA and tape figures above remain the primary measurements.
5.2 Tape measurements
| Site (cm) | 19 Apr | 18 May | 11 Jun | Change |
|---|---|---|---|---|
| Waist (normal) | 131 | 124 | 119 | −12 |
| Hips | 130 | 122 | 120 | −10 |
| Chest | 118.5 | 116.5 | 115.5 | −3 |
| Neck | 43 | 42 | 41 | −2 |
| Right thigh | 76 | 73.5 | 70 | −6 |
| Left thigh | 76 | 73.5 | 70 | −6 |
A 12 cm drop in waist circumference points to loss of visceral fat, the fat stored around the organs. That fits the BIA visceral-fat index falling from 16.0 to 13.0, and it lines up with the lipid and inflammation improvements below.
5.3 Lipids and cardiovascular risk
| Marker (units) | 17 Mar | 15 May | 11 Jun | Reference | Change |
|---|---|---|---|---|---|
| Triglycerides (mg/dL) | 164 | 68 | 72 | <150 | −56% |
| Total cholesterol (mg/dL) | 146 | 153 | 127 | <200 | −13% |
| LDL-C, direct (mg/dL) | 102 | — | 93 | <100 | −9% |
| HDL-C (mg/dL) | 33 | 41 | 38 | 40 to 60 | +15% (still low) |
| Non-HDL-C (mg/dL) | 113 | — | 89 | <160 | −21% |
| Apolipoprotein B (mg/dL) | 82 | — | 64 | −22% | |
| ApoB : ApoA1 ratio | 0.80 | — | 0.64 | Low risk <0.9 (M) | improved |
| Triglyceride : HDL ratio | 5.0 | — | 1.9 | <3.1 | improved |
The big results are the triglyceride drop of 56% and the apolipoprotein B drop of 22%. ApoB counts the number of atherogenic particles in the blood, and it is now considered a more accurate marker of cardiovascular risk than LDL cholesterol on its own [1,2,3]. In the INTERHEART study across 52 countries, the ApoB to ApoA1 ratio was the strongest lipid-related predictor of heart attack [2]. His triglyceride-to-HDL ratio, a practical proxy for insulin resistance, fell from 5.0 to 1.9. HDL stayed below target at 38 mg/dL, so raising it is on the list of ongoing work.
5.4 Blood sugar
| Marker | 17 Mar | 15 May | 11 Jun | Reference |
|---|---|---|---|---|
| HbA1c (%) | 5.5 | 5.4 | 5.2 | <5.7 [4] |
| Fasting glucose (mg/dL) | 100 | — | 85 | 70 to 100 |
HbA1c fell at every reading, and fasting glucose moved to mid-range. That is a real improvement in glucose handling rather than one lucky result.
5.5 Micronutrients
| Marker | 17 Mar | 11 Jun | Reference | Change |
|---|---|---|---|---|
| 25-OH Vitamin D (ng/mL) | 22.4 | 95.1 | 30 to 100 (sufficiency) [5] | +325% (deficient to sufficient) |
| Vitamin B12 (pg/mL) | 207 | 411 | ~211 to 911 | +98% |
| Homocysteine (µmol/L) | — | 17.67 | 6 to 14 | elevated (single timepoint), follow-up item |
5.6 Blood count and iron
| Marker | 17 Mar | 11 Jun | Reference |
|---|---|---|---|
| Haemoglobin (g/dL) | 14.2 | 15.1 | 13.0 to 17.0 |
| MCH (pg) | 26.8 | 28.0 | 27.0 to 32.0 |
| MCHC (g/dL) | 30.9 | 33.5 | 31.5 to 34.5 |
| Serum iron (µg/dL) | 55.5 | 65 | 65 to 180 |
| Transferrin saturation (%) | 15.6 | 14.4 | 13 to 45 |
| Ferritin (ng/mL) | — | 25.9 | 23.9 to 336 |
Haemoglobin rose and two previously low red-cell indices came back into range. Iron stayed borderline-low, which is unsurprising given rapid fat loss and heavy training, and it is a clear target for the next phase.
5.7 Kidney, inflammation, and incidental findings
| Marker | 17 Mar | 15 May | 11 Jun | Reference |
|---|---|---|---|---|
| hs-CRP (mg/L) | 6.36 | 1.84 | 3.55 | <1 to 3 |
| Creatinine (mg/dL) | 0.66 | — | 0.73 | |
| eGFR (CKD-EPI) | 134 | — | 130 | >90 [6] |
| Uric acid (mg/dL) | 7.52 | — | 6.6 | 3.5 to 7.2 |
hs-CRP fell hard from baseline (6.36) to a mid-program low (1.84), then ticked back up to 3.55 at the final reading. The most likely reason is the acute-phase response to the HYROX circuit the day before, not a reversal of the gains. The mid-program value of 1.84 is probably closer to his rested state. Two incidental findings were referred out: total IgE was high at 1,878 IU/mL, which points to an allergic or atopic process unrelated to the program, while testosterone (483 ng/dL) and thyroid were normal. The baseline heavy-metal screen was clean, which rules out metal toxicity as a hidden factor.
5.8 Liver and muscle enzymes
| Marker | 17 Mar | 15 May | 11 Jun | Reference |
|---|---|---|---|---|
| AST / SGOT (U/L) | 16.9 | 31 | 344 | <35 to 50 |
| ALT / SGPT (U/L) | 21.3 | 29 | 104 | <45 to 50 |
| AST : ALT ratio | 0.8 | — | 3.31 | |
| GGT (U/L) | 18.4 | 18 | 22 | <55 |
| ALP (U/L) | 70 | 62 | 78 | 43 to 129 |
| Total bilirubin (mg/dL) | 0.41 | — | 0.75 | <1.2 |
| Albumin (g/dL) | 3.91 | — | 4.60 | 3.5 to 5.2 |
| Hepatitis B surface antigen | — | — | Non-reactive |
On the final panel, AST rose to roughly 7 to 10 times the upper limit and ALT to about double, after being normal at both earlier readings. That draw came roughly 24 hours after a hard HYROX-format circuit. We read the finding with that fact front and centre, and a rested repeat panel is scheduled to confirm it. The full reasoning is in Section 6.3.
6. Discussion
6.1 What the program achieved, and why it holds up
The headline is not the number on the scale. It is what that weight was made of. By BIA, the loss broke down as 10.7 kg of fat with total body water and protein mass unchanged and skeletal muscle slightly higher. That is high-quality body recomposition. It also answers the two standard criticisms of fast weight loss in one dataset: the loss was not water, because body water was identical, and it was not muscle, because lean mass held and BMR stayed flat. Body fat came down to 37.9% by both measurement methods. When two separate instruments land on the same figure, the result stops looking like a quirk of one device and starts looking solid.
6.2 Why the blood and the body tell the same story
The blood results are the same story measured a third way. The 12 cm waist reduction and the falling visceral-fat index both signal loss of the fat stored around the organs, and that fat is a major driver of high triglycerides, low HDL, insulin resistance, and inflammation. So a 56% triglyceride drop, a 22% ApoB drop, a steady HbA1c fall, and lower hs-CRP are exactly what the body-composition data would lead you to expect. Three measurement systems point the same way.
6.3 The liver enzymes, and the trigger we can name
A sharp AST and ALT rise on a fitness-program panel is the kind of result that separates a careful program from a careless one. Here is the reasoning in full.
The pattern argues against liver disease. GGT, ALP, and bilirubin were all normal. Synthetic function actually improved, with albumin at 4.60 g/dL. Hepatitis B was non-reactive, the heavy-metal screen was clean, and AST was far higher than ALT, with a ratio of 3.3.
There is also a specific, dated trigger. AST and ALT are abundant in skeletal muscle, and intense eccentric exercise causes them to leak into the blood alongside CK and myoglobin. In a well-known study, healthy men who were not used to weightlifting showed large AST and ALT rises after a single session, lasting at least seven days, while bilirubin, GGT, and ALP stayed normal [7]. That is the pattern we see. Samkith completed a hard HYROX-format circuit (sled pushes and pulls, lunges, wall balls, running) about 24 hours before the draw, which puts the sample well inside that window. The small rise in CRP and creatinine fits the same muscular stress. This is a recognised pre-analytical effect with a clear cause, not an unexplained signal. The recomposition context backs it up too, since holding onto muscle while losing nearly 11 kg of fat takes exactly this kind of training.
That said, naming a likely cause is not the same as confirming it. The right step is a repeat liver panel after a period of rest, ideally with a creatine kinase test, which is the single most useful marker and was not run on this panel. The lab itself flagged CK for follow-up. That repeat is booked at his 4-week follow-up, described in Section 9. A single panel cannot fully rule out a liver cause such as supplement-related strain or fatty liver, which is plausible given his starting weight, so we are treating the result as open until the repeat confirms it.
7. Limitations
This case study has real limits, and naming them is part of its credibility.
- It is one participant. Nothing here generalises to typical results.
- BIA is an estimate. Consumer bioelectrical impedance is not the laboratory gold standard, such as DEXA, and it is sensitive to hydration. Stable body water supports the readings here, and agreement with a second method helps, but the absolute compartment values carry uncertainty.
- The baseline weight differs slightly by method and date: 115.4 kg on the manual scale on 19 April, 113.1 kg on the BIA on 22 April. Both devices agreed on the 11 June endpoint of 102.5 kg. A lab booking record listing 110 kg that day looks like a self-reported or booking entry error.
- The baseline bloods came from a different laboratory than the follow-up panels, with different methods and reference ranges, and the baseline panel was taken about four weeks before the program started.
- Several markers (homocysteine, ferritin, IgE, testosterone) were measured only once.
- No CK was run, and the final blood draw followed a HYROX circuit by about 24 hours, a known cause of temporary rises in liver enzymes, CK, and CRP. Those specific values do not reflect his rested state. Future panels should include a 48 to 72 hour rest from training before the blood draw.
8. Coaching Scope Versus Medical Scope
We held a firm line throughout. Reading biomarkers to guide coaching is not the same as making a medical diagnosis. Trends in body composition, lipids, blood sugar, and micronutrients inform training and nutrition, which is coaching work. Findings such as a markedly raised liver enzyme, an IgE of 1,878, or a high homocysteine are flagged and referred to qualified doctors. They are not diagnosed or treated by the coaching team.
9. Follow-Up and Ongoing Monitoring
This is an ongoing journey, not a finished result. By the BIA scale's own standard-weight reference, Samkith is still about 27.6 kg above target. He has signed up for a 4-week online continuation program, starting 17 June 2026. A rested repeat liver panel, ideally with a creatine kinase test, is booked at the 4-week mark, once the HYROX-related muscle stress has cleared. If those values normalise, that confirms the exercise-induced reading of the liver result. Iron status and HDL, the two markers still outside target, are the named priorities for the next phase. Reporting the journey as ongoing, with the unfinished work spelled out, is deliberate. That is what an honest long-term program looks like.
10. Conclusion
In eight weeks, an evidence-based residential fitness bootcamp produced a high-quality body recomposition in a 24-year-old. He lost about 13 kg, with roughly 10.7 kg of it confirmed as fat by BIA, while his lean mass and metabolic rate held and his body fat came down to 37.9% by two methods. His waist dropped 12 cm. Alongside that, his lipids, blood sugar, micronutrients, and inflammation all improved. The same monitoring that recorded those gains also caught a liver-enzyme rise, explained it, and booked a rested repeat to confirm it. A measured result, an honest account of an explained finding, and a clear plan for what comes next. That is what a serious residential program looks like when it shows its full working.
A mirror shows you a person. A scale shows you a number. Body composition and blood show you the program.
Frequently Asked Questions
What is a residential fitness camp or fat-loss bootcamp?
A live-in program that combines structured training, supervised nutrition, and recovery over several weeks. A serious one tracks body composition and blood markers, not just appearance.
How much can you realistically lose in an 8-week residential program?
Samkith lost about 13 kg, with body-composition analysis confirming roughly 10.7 kg of it was fat, while keeping his muscle and lowering body fat to 37.9%. Results vary widely from person to person. This is one documented case, not a promise.
Isn't fast weight loss just water and muscle?
That is the usual risk, which is why we measured it. The impedance analysis showed total body water unchanged and lean mass preserved across the program, with basal metabolic rate steady. The loss was fat, not water or muscle.
Why were the liver enzymes high at the end?
Samkith did a hard HYROX-format circuit about 24 hours before the blood test, and intense exercise is a well-recognised, usually temporary cause of raised AST and ALT. The pattern (high AST relative to ALT, with normal GGT, ALP, and bilirubin) is the classic signature of muscle-origin enzyme release rather than liver disease. The way to confirm it is a repeat panel after a few days of rest, ideally with a creatine kinase test, and that is booked at his 4-week follow-up.
Is this medical advice?
No. This is an educational case study about one person. Always consult a qualified doctor before starting any intensive program or interpreting your own results.
About the Author
Coach Niraj Kumar Borah is the founder of Fitness Bootcamp and the coach who ran this program. His credentials include Precision Nutrition Level 1 (PN1), VDOT-Certified Running Coach, HYROX Performance Coach, Bioforce Conditioning Coach, and Certified MMA Conditioning Coach, along with a BJJ Blue Belt (Gracie Barra). He holds a BSc (Hons) in Business Information Systems from the University of East London.
These are coaching and conditioning credentials, not medical ones. Every clinical finding in this case study, such as the raised liver enzymes and the high IgE, was referred to qualified doctors rather than diagnosed or treated by the coaching team. This article has not been independently medically reviewed, and readers should make any health decisions with their own physician.
References
- Sniderman AD, et al. Physiological bases for the superiority of apolipoprotein B over LDL cholesterol and non-HDL cholesterol as a marker of cardiovascular risk. Journal of the American Heart Association. 2023.
- Yusuf S, Hawken S, Ôunpuu S, et al. Effect of potentially modifiable risk factors associated with myocardial infarction in 52 countries (the INTERHEART study): case-control study. Lancet. 2004;364(9438):937–952.
- Sniderman AD, Williams K, Contois JH, et al. A meta-analysis of LDL-C, non-HDL-C, and apolipoprotein B as markers of cardiovascular risk. Circulation: Cardiovascular Quality and Outcomes. 2011.
- American Diabetes Association. Standards of Medical Care in Diabetes. 2023.
- Holick MF. Vitamin D deficiency. New England Journal of Medicine. 2007;357:266–281.
- Inker LA, Eneanya ND, Coresh J, et al. New creatinine and cystatin C based equations to estimate GFR (CKD-EPI 2021), building on Levey AS, et al. Annals of Internal Medicine. 2009;150(9):604–612.
- Pettersson J, Hindorf U, Persson P, et al. Muscular exercise can cause highly pathological liver function tests in healthy men. British Journal of Clinical Pharmacology. 2008;65(2):253–259.
Consent and Disclaimer
Consent. This case study uses individual health data and is published with the participant's explicit, documented, informed written consent on file. That consent covers his name, photograph, and body-composition and blood-biomarker results, for use in educational and marketing materials on the program's website and social media. It is held in line with applicable data-protection law, including India's Digital Personal Data Protection Act, 2023, and the participant keeps the right to withdraw it. Tape measurements were recorded and counter-signed by the participant and coach.
Medical disclaimer. This article is for education only. It is not medical advice, diagnosis, or treatment. It describes one person and does not represent typical results. Body-composition figures came from consumer bioelectrical-impedance analysis and manual tape measurement, both estimates rather than gold-standard methods, and blood values came from third-party accredited laboratories, read for coaching and education rather than diagnosis. Any abnormal result here was, and any abnormal result you find should be, evaluated by a qualified doctor. Do not begin an intensive exercise or nutrition program without appropriate medical clearance.